Trends in key macroeconomic indicators

GDP Growth

GDP growth - 2000 - 2022
Between 2000 and 2021, the UK economy grew at an average of 2.2%, but also experienced two significant economic shocks. Firstly, GDP fell by around 6% in the four quarters between 2008 (Q2) and 2009 (Q1) as a result of the financial crisis of 2008. GDP returned to growth between 2010 and 2019, and then experienced a steep decline as a consequence of the Covid pandemic and associated lockdown policies. The UK quickly returned to growth in the third quarter of 2020, with a considerable bounce back following the relaxation of lockdown and aided by the unprecedented levels of government support. Growth then returned quickly to its pre-Covid average growth rate.
However, estimates suggest that UK GDP fell by 0.1% in Quarter 2 (Apr to June) 2022. In output terms, services fell by 0.4% in Quarter 2 2022 with the largest negative contribution from human health and social work activities, which reflected the reduction in coronavirus (COVID-19) activities.
Travel agencies and tour operators did well as COVID-19 restrictions eased on the tourism industry. Overall, estimates suggest that there was a 0.2% decrease in real household consumption in the second quarter of 2022.
Read more on growth.
Inflation

CPI Inflation - 1989 - 2022
Inflation trended downwards in the decade ending in 2000, falling from 9.2% in 1989 to 1.5% by 1999. Between 2000 and 2005, UK inflation (as measured by the CPI(H*)) stayed below the Bank of England's target rate of 2% - indicating non-inflationary growth during this period. From 2005 until the impact of the financial crash, inflation rose above target and peaked at 4.5% in 2008, eventually falling back to an annual rate of 1.5% by 2009. The post-crash recovery saw inflation climb back up to 4%, before once again falling back to less than 0.5% by 2015.
Inflation peaked again at 2.75% in 2017 - but still within the Bank of England's target range of 2% (+/- 1%). Inflation gradually fell back until 2020, when the impact of the pandemic, and supply-chain issues, pushed inflation back up towards 3% by the second quarter of 2021. Inflation continued to rise, fuelled by increased consumer spending as a result of the removal of lockdown restrictions.
Rising oil and commodity prices pushed the rate to 6.2% (in March 2022), with expectations of a much steeper rise in prices as a result of the uncertainties following the Russia-Ukraine conflict. By September 2022, inflation had risen to 8.6%, the highest rate for 32 years.
*CPI(H) is the consumer price index, including homeowner's housing costs.
Read more on inflation.
Unemployment

Unemployment - 2000 - 2022
UK unemployment, which had remained at around 5% between 2000 and 2007, rose quickly following the financial crisis of 2008. By 2011, unemployment had risen to over 8% but fell back as the economy came out of recession. There followed an eight-year decline between 2011 and 2019. The impact of the pandemic can be seen with unemployment beginning an upward trend from the first quarter of 2020.
The long-term effects of the
Covid-19 pandemic remain unknown. While there was a blip during 2021,
unemployment fell back to 4.5% in late 2021, and then to 3.9% in
January 2022
These estimates would have been much
higher were it not for the UK's furlough scheme.
It should be noted that unemployment is a lagging indicator, which means that the labour market is relatively slow to adjust to changes in spending and output. For example, unemployment did not start to fall for at least 18 months after the end of the financial crisis - which came to an end in the last quarter of 2009.
Estimates by the OBR suggested that NAIRU is around 5% in the UK.
Read more on unemployment.
Long term unemployment

Long term unemployment - 2000 - 2021
The pattern for long term unemployment (unemployment for longer than 12 months) is very similar to that of all adult unemployment. Strong economic growth as the economy recovered from the financial crisis led to a consistent decline in long term unemployment, down from 900,000 in 2013 to around 250,000 in 2020. However, the impact of the pandemic can be seen from 2020 onwards, with long term unemployment rising above 400,000 in 2021. As with adult unemployment, long-term unemployment is a lagging indicator.
Current account

UK current account - 2000 - 2021
The UK's current account has been in deficit over the whole period considered, and indeed the UK has been running at current account deficit since the 1990s. Changes in the size of the deficit reflect several factors, but are mainly the result of changes in domestic demand associated with the business (economic) cycle.
For example, as the UK economy emerged from the financial crisis, consumer confidence and spending began to rise. Given that imports are largely determined by domestic demand, we would expect a worsening of the current account during the growth phase of the business cycle, and this can be seen from 2011 to 2017.

Productivity

Productivity growth - 2010 - 2021
There has been a gradual decline in productivity growth - as measured by output per hour worked - with occasional fluctuations. There were three periods of negative productivity growth - during 2012, during 2014 and 2019. Over the whole period, productivity did grow but at a declining rate.
The ability of an economy to make productivity improvements is central to its long term growth prospects.
Productivity gap
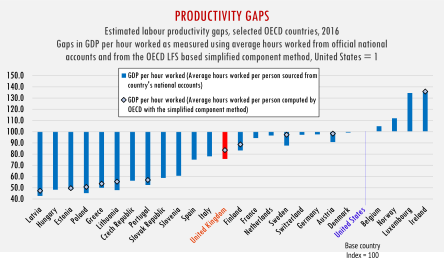
The productivity gap
A productivity gap is the difference between the productivity levels of a particular country and those of its major competitors. Productivity comparisons are best undertaken by using an index, and then comparing how countries are performing in terms of this index. For international comparisons, the USA is taken as the 'base' country, and given a value of 100, with other countries given values above or below 100.
The UK is given an index value or 75, indicating that the UK is 25% less productive than the USA. In contrast, Ireland has an index value of 135, which is the highest of the OECD countries listed.
Read more on productivity.